The Impact of Different Macroeconomic Variables on Small, Medium, and Large Firms
A Study for the Mexican Stock Market


In June 2017, the Mexican Stock Exchange and S&P Dow Jones Indices released a number of different composite market indices. Three of those indices are the large_cap, mid_cap, and small_cap indices which capture separately the firm capitalization value of firms listed in the Mexican stock market. The study has been developed using as a guide similar studies available in the literature performed for different countries which analyze the effect of different macroeconomic variables on small, medium, and large firms. Results in such literature argue that macroeconomic variables could have different effects on each of those firms depending on the firm valuation size because the hedging strategies that such firms can take. Some examples of such literature are: Salisu et al. (2017), Gevorkyan and Semmler, (2016), Drimbetas et al. (2010), and Peng et al. (2017).
In this study we employ daily observations of S&P/BMV large-cap, mid-cap, and small-cap index returns, exchange rate (Mexican pesos per US dollar (MXNUSD)), a Mexico risk premium variable which is the difference between the Mexican and US government 3-month T-bills, the West Texas Intermediate crude oil (WTI), the volatility index (VIX), and a dummy variable to capture the effect of the 2008-2009 economic recession on each of those firm capitalization indices. The analyzed period spans from October 24th, 2006 to February 16th, 2021 and is estimated for periods including and excluding the COVID-19 pandemic period. Estimates just for the COVID-19 period cannot be obtained because the number of observations during such period is not big enough to get robust and statistically valid results. All variables are extracted from Refinitiv, excluding the exchange rate which it was extracted from Mexico’s central bank website.
Figure 1: S&P/IPC Large, Mid, and Small-Cap Index, October 2006 to February 2021
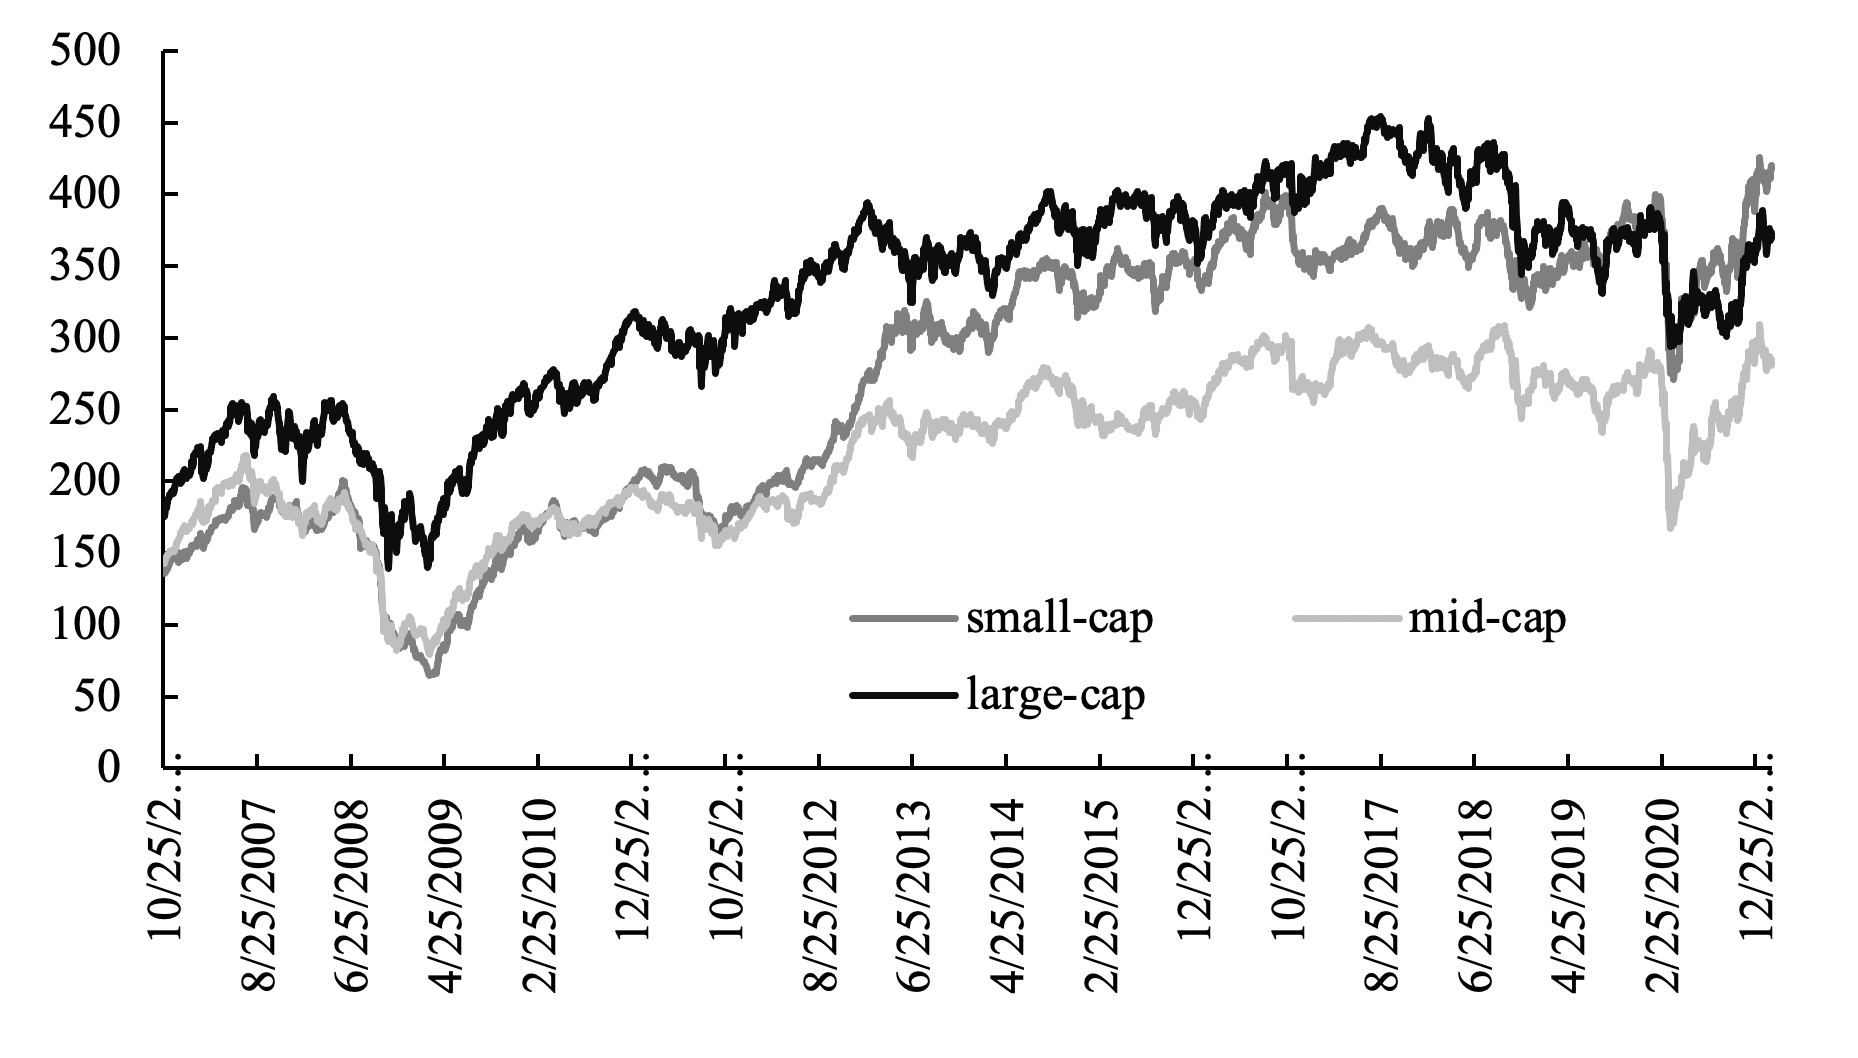
Source: Own elaboration with information extracted from Refinitiv. The indices were seasonally adjusted using the STL methodology. The term “sa “stands for seasonally adjusted.
According to Figure 1, all three indices decreased during 2008-2009 financial crisis. The small-cap index has the highest compound annually growth rate among the three indices analyzed in this study, reaching a 6.5% as of August 2020, compared to 4% and 3.7% obtained for the large and mid-cap, respectively. These results show small-cap resilience during the last stock market shock as part of COVID-19 worldwide pandemic outbreak and the restriction measures imposed on the economy to contain it. During the analyzed period in this study, the dollar had a minimum value of 9.9 MXN per US dollar in August 2008; while the maximum value was 25.3 MXN per US dollar in March 2020, indicating a depreciation in the Mexican peso of 157% against the US dollar during the period. Another analyzed variable is the West Texas Intermediate (WTI) which reached a minimum value of $8.9 per barrel in April 2020 and a maximum value of $145 in March 2008, which represent a 1,531% change in value. It is important to mention that the lowest price in oil prices it was due to the sudden cut off in the demand for oil and its derivatives, originated due to the unprecedented COVID-19 pandemic disease. An additional variable included in this study is the Mexico market risk premium which is a premium rate that must be compensated to investors in order they decide to invest in Mexico instead of the US. The mean value is 4.52 percentage points while the maximum value is 8.2, and the minimum is 1.8 percentage points. The difference in such values could easily indicate the high volatility that could exist in the Mexican economy in comparison to the US economy. Another included variable in the analysis is the Chicago Board Options Exchange Market Volatility Index (VIX), which represents a measure of 30-day expected volatility in the U.S. stock market. On a global basis, the VIX Index is one of the most recognized measures of volatility closely followed by a variety of market participants as a daily market indicator. The trough value occurred in March 2017 when the VIX was 9.14, while the peak value is in November 2008 when reached 80.9, near the market crash occurred in September 2008.
In the empirical model the dependent variable is the return over the whole IPC (Prices and Quotations Index) of the Mexican stock exchange for the entire period analyzed in this study (October 2006 to February 2021) and for the period excluding the COVID-19 era which started on March 11, 2020, when the World Health Organization declared COVID-19 as a pandemic disease.
Results
Results show that coefficients are statistically significant and similar in sign when the COVID-19 period is either included or excluded from the analysis. Obtained results also indicate that the lag of the Mexican stock market estimate (previous day value) is positive and statistically significant; indicating that stock price index has an important dependence from its previous values.
Regarding the exchange rate variable, it is important to mention that an increase in the exchange rate means a depreciation of the Mexican peso against the US dollar. Results show a negative and statistically significant effect of the exchange rate on each of the Mexican stock market indexes, indicating that a depreciation of the Mexican peso creates a negative effect on small, medium and the large firms listed in the Mexican stock market.
Estimates about the WTI price variable indicates a positive effect on the Mexican stock market index across all indices either for the entire analyzed period and for the period excluding the COVID-19 period.
The VIX index is used to model the variability of the Mexican stock market. Estimates report a positive and statistically significant value across all the econometric models implemented in the study and are significant at 1% significance level. Those results indicate that VIX index is a good variable to explain an important portion of the total variability daily in the Mexican stock market. Those results could be explained by the openness of the Mexican Stock Market to foreign investors as it is explained by López Herrera et al. (2015) and are confirmed by Fonseca-Ramírez et al. (2019).
In the case of the risk premium variable results are negative and statistically significant across the different stock market indices. Such results indicate that when the Mexican economy become more unstable in comparison to the US economy, the premium to retain investments in Mexico increases, but the stock market indexes decrease anyway. Lastly, the US economic crisis 2008-2009 dummy variable results indicate a negative and statistically significant effect on the mid-cap, and small-cap indices, but not statistically effect on the large-cap index. Such results could indicate the 2008-2009 US economic had a stronger negative effect on small and medium capitalization value firms than in large firms.
Conclusion
Obtained results indicate that oil prices, exchange rate, and the risk premium value are having similar statistically significant effects on the Mexican stock market index no matter the firm size value. In addition, the 2008-2009 economic recession had a stronger effect on small and medium firms, but not on large firms and lastly, the VIX index is a good predictor to explain the total variance in the Mexican stock market index.
A potential reason because estimates found in this paper are similar across firm value indices is probably due to the methodology used by Standard & Poors to construct such indices. It is difficult to construct robust indices when the number of firms available in the Mexican stock market is limited and these are the only formal indices available about the Mexican stock market regarding firm value size available until this day.
References
Drimbetas, E., Sariannidis, N., Giannarakis, G., & Litinas, N. (2010). The Effects of Macroeconomic Factor on the Sustainability, Large-Cap and Mid-Cap Dow Jones Indexes. International Journal of Business Policy and Economics, 3, 21-36.
Fonseca-Ramírez, A., Santillán-Salgado, R. J., & López-Herrera, F. (2019). Incidencia de las fluctuaciones del índice VIX en la volatilidad de los mercados bursátiles latinoamericanos/VIX Index Spillover on Latin American Stock Markets Volatility. Estocástica: Finanzas y Riesgo, 9(1), 97-123.
Gevorkyan, A., & Semmler, W. (2016). Oil price, overleveraging and shakeout in the shale energy sector—Game changers in the oil industry. Economic Modelling, 54, 244-259.
López Herrera, F., Santillán Salgado, R. J., & Cruz Ake, S. (2015). Volatility dependence structure between the Mexican stock exchange and the world capital market. Investigación económica, 74(293), 69-97.
Peng, C., Zhu, H., Jia, X., & You, W. (2017). Stock price synchronicity to oil shocks across quantiles: Evidence from Chinese oil firms. Economic Modelling, 61, 248-259
Salisu, A. A., Swaray, R., & Oloko, T. (2017). U.S. stocks in the presence of oil price risk: Large cap vs. Small cap. Economics and Business Letters, 6(4), 116-124.